Toronto and Etobicoke Real Estate Home Sales for year end 2019
Happy New Year and welcome to 2020! With the start of this new decade, I have to say I’m very pumped and inspired about this new year in real estate. I have been working very hard on many ways to be of greater service to you and bring you even more value in all things real estate in 2020!
Whether you are thinking of buying a home, selling the one you are in, need some real estate advice, want to stay current on what is happening in the real estate market, thinking about buying an investment property, or would like to know how to increase the value of the home you are in, I’ve got you covered! Stay tuned for lots of information and goodies from me.
In the meantime, let’s do a recap of how 2019 ended.

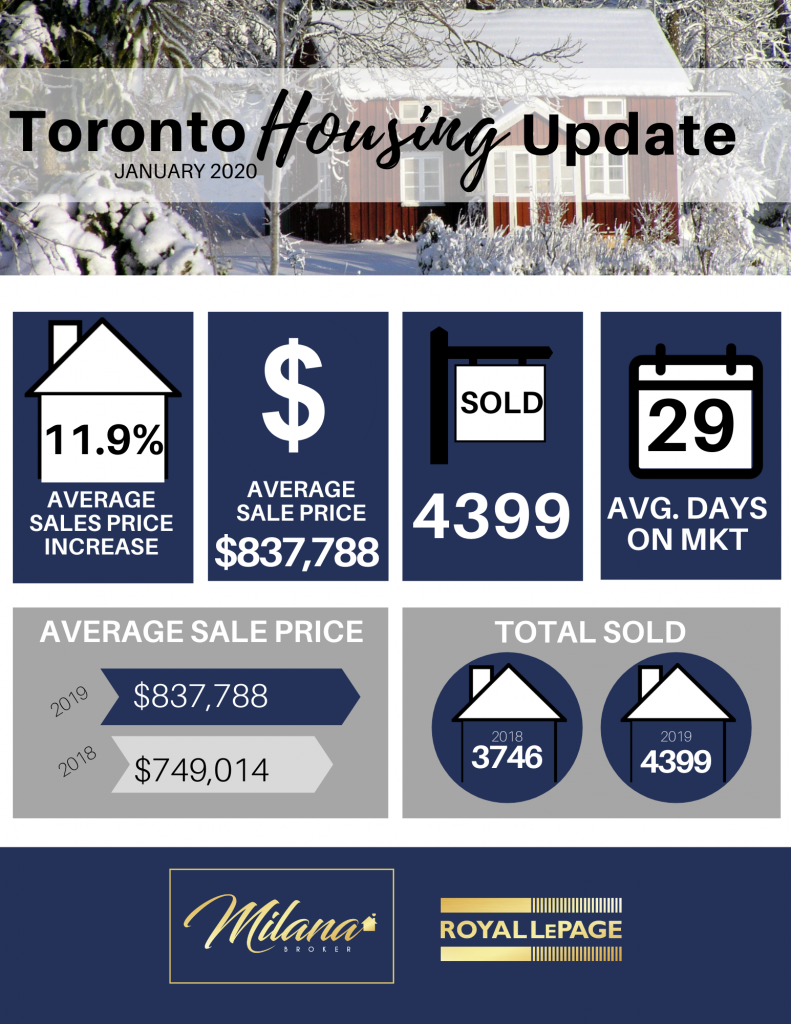
While GTA buyers were stress-test-adjusted and benefiting from lower interest rates, the December 2019 real estate market heavily favoured sellers. The Toronto Real Estate Board MLS has reported a near 12% increase in the average selling price of a GTA home over the previous year – $837,788 in December 2019 compared to $749,014 in December 2018.
This remarkable price acceleration points directly to historic lows of available active listings that, in December 2019, were down by over 35%, which is equal to 4,000 fewer active listings than in 2018. Despite the inventory challenge intensifying, transactions in Canada’s largest real estate market for all of 2019 increased by 12.6% year over year, finishing out at 87,825.
“Over the last ten years, TREB has been drawing attention to the housing supply issue in the GTA. Increasingly, policy makers, research groups of varying scope and other interested parties have acknowledged that the lack of a diverse supply of ownership and rental housing continues to hamper housing affordability in the GTA. Taking 2019 as an example, we experienced a strong sales increase up against a decline in supply. Tighter market conditions translated into accelerating price growth. Expect further acceleration in 2020 if there is no relief on the supply front,” said Jason Mercer, TREB’s Chief Market Analyst.

Here is a snapshot of homes sold in Etobicoke for the month of December covering the areas from south (the Lake) to north (Eglinton) and more specifically the real estate districts of W06, W07 and W08.
ETOBICOKE REAL ESTATE MARKET WATCH
| District | Active | Sold/Month | Sold/Year | Average$/Month |
|---|---|---|---|---|
| Area Total: | 252 | 176 | 3480 | |
| W06 | 131 | 77 | 1558 | $707,623 |
| W07 | 19 | 16 | 248 | $1,379,531 |
| W08 | 102 | 83 | 1674 | $822,227 |
How did your Etobicoke market do? Do you have questions about your Etobicoke home and wonder where it may fall within theses stats?
Being active in Etobicoke Real Estate on a daily basis I am able to provide you with up to date local market statistics. This way, you are kept in the know about your home’s worth.
For more detailed information on your Etobicoke neighbourhood or more specifically on your own home. I invite you to give me a call 647-225-8255 or e-mail me today
THIS INFORMATION IS CRITICAL FOR MAKING A DECISION IF YOU ARE THINKING ABOUT WHETHER NOW IS A GOOD TIME TO SELL, BUY OR JUST ENJOY YOUR HOME FOR MANY YEARS TO COME!


You must be logged in to post a comment.