Toronto and Etobicoke Real Estate Homes Sales for September 2017

Looking for current information on Toronto and Etobicoke Real Estate Home Sales for September 2017?
GTA REALTORS® Release September Stats
Toronto Real Estate Board President Tim Syrianos announced that Greater Toronto Area REALTORS® reported 6,379 sales through TREB’s MLS® System in September 2017. This result was down by 35 per cent compared to September 2016.
The number of new listings entered into TREB’s MLS® System amounted to 16,469 in September – up by 9.4 per cent year-over-year.
“The improvement in listings in September compared to a year earlier suggest that home owners are anticipating an uptick in sales activity as we move through the fall. Consumer polling undertaken for TREB in the spring suggested that buying intentions over the next year remain strong. As we move through the fourth quarter we could see some buyers moving off the sidelines, taking advantage of a better-supplied marketplac3e,” said Mr. Syrianos.
The average selling price in September 2017 was $775, 546 – up 2.6% compared to September 2016. The MLS® Home Price Index (HPI) composite benchmark was up by 12.2% on a year-over-year basis. A key reason for the difference in annual growth rates between the average price and the MLS® HPI composite is the fact that detached homes – the most expensive market segment on average – accounted for a smaller share of overall transactions this year compared to last.
“With more balanced market conditions, the pace of year-over-year price growth was more moderate in September compared to a year ago. However, the exception was the condominium apartment market segment, where average and benchmark sales prices were up by more than 20% compared to last year. Tighter market conditions for condominium apartments follows consumer polling results from the spring that pointed toward a shift to condos in terms of buyer intentions,” said Jason Mercer, TREB’s Director of Market Analysis.
But that is only a snapshot of what happened in the GTA. If you are looking for Etobicoke Real Estate Home Sale stats for your local area, I have you covered.
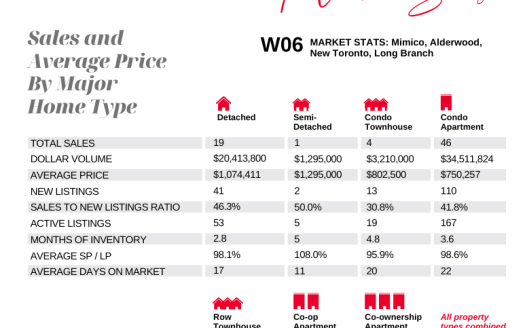
Here is a snapshot of homes sold in the month of September for Etobicoke:
ETOBICOKE REAL ESTATE MARKET WATCH
| District | Active | Sold/Month | Sold/Year | Average$/Month |
|---|---|---|---|---|
| Area Total: | 583 | 252 | 3015 | |
| W06 | 249 | 114 | 1351 | $664,229 |
| W07 | 36 | 16 | 215 | $1,111,678 |
| W08 | 298 | 122 | 1449 | $739,455 |
How did your Etobicoke market do? Do you have questions about your Etobicoke home and wonder where it falls within theses stats?
For more detailed information on your Etobicoke neighbourhood or more specifically on your own home. I invite you to give me a call at 416-762-8255 or e-mail me today
PART OF MY JOB AS YOUR REALTOR® IS TO PROVIDE YOU WITH UP TO DATE LOCAL MARKET STATISTICS. THIS WAY YOU ARE KEPT IN THE KNOW ABOUT YOUR HOME’S WORTH.
THIS INFORMATION IS CRITICAL FOR MAKING A DECISION IF YOU ARE THINKING ABOUT WHETHER NOW IS A GOOD TIME TO SELL, BUY OR JUST ENJOY YOUR HOME FOR MANY YEARS TO COME!


You must be logged in to post a comment.