Toronto and Etobicoke Real Estate Homes Sales for July 2017

Looking for current information on Toronto and Etobicoke Real Estate Home Sales for July 2017?
Market Continued to Adjust in July
Toronto Real Estate Board President Tim Syrianos announced that Greater Toronto Area REALTORS® reported 5,921 residential transactions through TREB’s MLS® System in July 2017. This result was down by 40.4% on a year over year basis, led by the detached market segment – both in the City of Toronto and surrounding regions. While sales were down, the number of new listings reported were only slightly (+5.1%) above last year’s level.
“A recent release from the Ontario government confirmed TREB’s own research which found that foreign buyers represented a small proportion of overall home buying activity in the GTA. Clearly, the year-over-year decline we experienced in July had more to do with psychology, with would-be home buyers on the sidelines waiting to see how market conditions evolve,” said Mr. Syrianos. “Summer market statistics are often not the best indicators of housing market conditions. We generally see an uptick in sales following Labour Day, as a greater cross-section of would-be buyers and sellers start to consider listings and/or purchasing a home. As we move through the fall, we should start to get a better sense of the impacts of the Fair Housing Plan and higher borrowing costs,” said TREB CEO John DiMichele.
The MLS® Home Price Index (HPI) Composite Benchmark price was up by 18% on a year-over-year basis. However, the Composite Benchmark was down by 4.6% relative to June. Monthly MLS® HPI declines were driven more so by single-family home types. The average selling price for all home types combined was up by 5% year-over-year to $746,218.
“Home buyers benefitted from more choice in the market this July compared to the same time last year. This was reflected in home prices and home price growth. Looking forward, if we do see some would-be home buyers move off the sidelines and back into the market without a similar increase in new listings, we could see some of this newfound choice erode. The recent changes in the sales and price trends have masked the fact that housing supply remains an issue in the GTA,” said Jason Mercer, TREB’s Director of Market Analysis.
But that is only a snapshot of what happened in the GTA. If you are looking for Etobicoke Real Estate Home Sale stats for your local area, I have you covered.
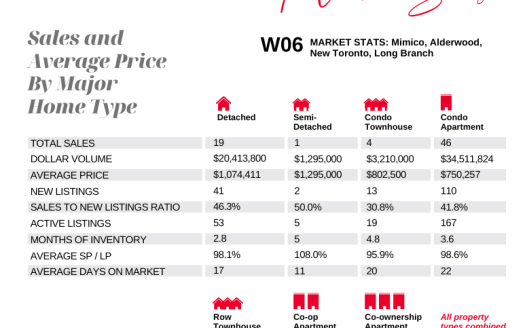
Here is a snapshot of homes sold in the month of July for Etobicoke:
ETOBICOKE REAL ESTATE MARKET WATCH
| District | Active | Sold/Month | Sold/Year | Average$/Month |
|---|---|---|---|---|
| Area Total: | 538 | 259 | 2489 | |
| W06 | 241 | 123 | 1109 | $610,073 |
| W07 | 46 | 19 | 182 | $1,327,042 |
| W08 | 251 | 117 | 1198 | $887,461 |
How did your Etobicoke market do? Do you have questions about your Etobicoke home and wonder where it falls within theses stats?
For more detailed information on your Etobicoke neighbourhood or more specifically on your own home. I invite you to give me a call at 416-762-8255 or e-mail me today
PART OF MY JOB AS YOUR REALTOR® IS TO PROVIDE YOU WITH UP TO DATE LOCAL MARKET STATISTICS. THIS WAY YOU ARE KEPT IN THE KNOW ABOUT YOUR HOME’S WORTH.
THIS INFORMATION IS CRITICAL FOR MAKING A DECISION IF YOU ARE THINKING ABOUT WHETHER NOW IS A GOOD TIME TO SELL, BUY OR JUST ENJOY YOUR HOME FOR MANY YEARS TO COME!


You must be logged in to post a comment.