Toronto and Etobicoke Real Estate Homes Sales for December 2017

Looking for current information on Toronto and Etobicoke Real Estate Home Sales for December 2017?
GTA REALTORS® Release December/Annual Stats
Toronto Real Estate Board President Tim Syrianos announced that Greater Toronto Area REALTORS® reported 92,394 sales through TREB’s MLS® System in 2017. This total was down 18.3 per cent compared to the record set in 2016.
Record sales in Q1 were followed by a decline in Q2 and Q3 after the Ontario Fair Housing Plan (FHP) was announced. The pace of sales picked up in Q4, as the impact of the FHP started to wane, and some buyers arguably brought forward their home purchase in response to the new OSFI stress test guidelines effective January 1, 2018.
“Much of the sales volatility in 2017 was brought about by government policy decisions. Research from TREB, the provincial government and Statistics Canada showed that foreign home buying was not a major driver of sales in the GTA. However, the Ontario Fair Housing Plan, which included a foreign buyer tax, had a marked psychological impact on the marketplace. Looking forward, government policy could continue to influence consumer behavior in 2018, as changes to federal mortgage lending guidelines come into effect,” said Mr. Syrianos.
The average selling price for 2017 as a whole was $822,681 – up 12.7 per cent compared to 2016. This annual growth was driven more so by extremely tight market conditions during the first four months of the year. In the latter two-thirds of 2017, fewer sales combined with increased listings resulted in slower price growth. In December, the MLS® Home Price Index (HPI) Composite Benchmark was up by 7.2 per cent year over year, and the overall average selling price was up by 0.7 per cent year over year.
“It is interesting to note that home price growth in the second half of 2017 differed substantially depending on market segment. The detached market segment – the most expensive on average – experienced the slowest pace of growth as many buyers looked to less expensive options. Conversely, the condominium apartment segment experienced double-digit growth, as condos accounted for a growing share of transactions,” said Jason Mercer, TREB’s Director of Market Analysis.
But that is only a snapshot of what happened in the GTA. If you are looking for Etobicoke Real Estate Home Sale stats for your local area, I have you covered.
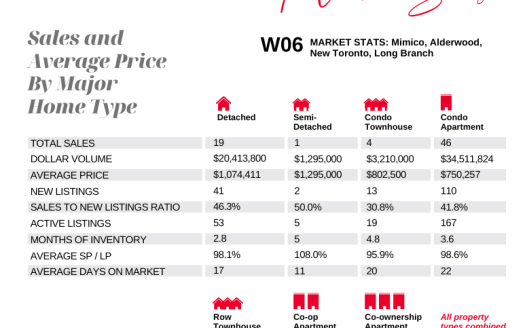
Here is a snapshot of homes sold in the month of December for Etobicoke:
ETOBICOKE REAL ESTATE MARKET WATCH
| District | Active | Sold/Month | Sold/Year | Average$/Month |
|---|---|---|---|---|
| Area Total: | 354 | 232 | 3848 | |
| W06 | 167 | 94 | 1698 | $646,336 |
| W07 | 31 | 17 | 282 | $845,518 |
| W08 | 156 | 121 | 1868 | $742,511 |
How did your Etobicoke market do? Do you have questions about your Etobicoke home and wonder where it falls within theses stats?
For more detailed information on your Etobicoke neighbourhood or more specifically on your own home. I invite you to give me a call at 416-762-8255 or e-mail me today
PART OF MY JOB AS YOUR REALTOR® IS TO PROVIDE YOU WITH UP TO DATE LOCAL MARKET STATISTICS. THIS WAY YOU ARE KEPT IN THE KNOW ABOUT YOUR HOME’S WORTH.
THIS INFORMATION IS CRITICAL FOR MAKING A DECISION IF YOU ARE THINKING ABOUT WHETHER NOW IS A GOOD TIME TO SELL, BUY OR JUST ENJOY YOUR HOME FOR MANY YEARS TO COME!


You must be logged in to post a comment.