Toronto and Etobicoke Real Estate Home Sales for April 2018

Looking for current information on Toronto and Etobicoke Real Estate Home Sales for April 2018? Here are your Toronto and Etobicoke Real Estate Homes Sales for April 2018
GTA REALTORS® Release April Stats
Toronto Real Estate Board President Tim Syrianos announced that Greater Toronto Area REALTORS® reported 7,792 sales through TREB’s MLS® System in April 2018. The average selling price was $804,584. On a year-over-year basis, sales were down by 32.1 per cent and the average selling price was down by 12.4 per cent.
The year-over-year change in the overall average selling price has been impacted by both changes in market conditions as well as changes in the type and price point of homes being purchased. This is especially clear at the higher end of the market. Detached home sales for $2 million or more accounted for 5.5 per cent of total detached sales in April 2018, versus 10 per cent in April 2017. The MLS® Home Price Index strips out the impact of changes in the mix of home sales from one year to the next. This is why the MLS® HPI Composite Benchmark was down by only 5.2 per cent year-over-year versus 12.4 per cent for the average price.
“While average selling prices have not climbed back to last year’s record peak, April’s price level represents a substantial gain over the past decade. Recent polling conducted for TREB by Ipsos tells us that the great majority of buyers are purchasing a home within which to live. This means these buyers are treating home ownership as a long-term investment. A strong and diverse labour market and continued population growth based on immigration should continue to underpin long-term home price appreciation,” said Mr. Syrianos.
“The comparison of this year’s sales and price figures to last year’s record peak masks the fact that market conditions should support moderate increases in home prices as we move through the second half of the year, particularly for condominium apartments and higher density low-rise home types. Once we are past the current policy-based volatility, home owners should expect to see the resumption of a moderate and sustained pace of price growth in line with a strong local economy and steady population growth,” said Jason Mercer, TREB’s Director of Market Analysis.
But that is only a snapshot of what happened in the GTA. If you are looking for Etobicoke Real Estate Home Sale stats for your local area, I have you covered.
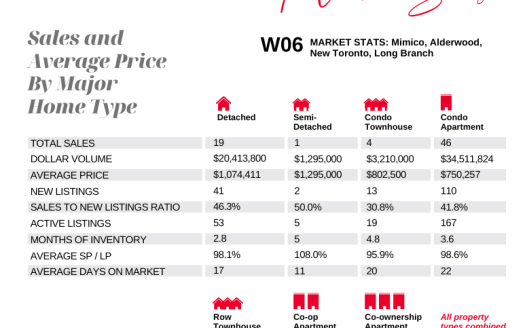
Here is a snapshot of homes sold in the month of April for Etobicoke:
ETOBICOKE REAL ESTATE MARKET WATCH
| District | Active | Sold/Month | Sold/Year | Average$/Month |
|---|---|---|---|---|
| Area Total: | 539 | 306 | 1018 | |
| W06 | 269 | 123 | 439 | $721,095 |
| W07 | 38 | 33 | 97 | $1,184,179 |
| W08 | 232 | 150 | 482 | $971,141 |
How did your Etobicoke market do? Do you have questions about your Etobicoke home and wonder where it falls within theses stats?
For more detailed information on your Etobicoke neighbourhood or more specifically on your own home. I invite you to give me a call at 416-762-8255 or e-mail me today
PART OF MY JOB AS YOUR REALTOR® IS TO PROVIDE YOU WITH UP TO DATE LOCAL MARKET STATISTICS. THIS WAY YOU ARE KEPT IN THE KNOW ABOUT YOUR HOME’S WORTH.
THIS INFORMATION IS CRITICAL FOR MAKING A DECISION IF YOU ARE THINKING ABOUT WHETHER NOW IS A GOOD TIME TO SELL, BUY OR JUST ENJOY YOUR HOME FOR MANY YEARS TO COME!


You must be logged in to post a comment.